Every statistic here comes from the original report, not from another blog. Each one says which year it was measured and how many organisations it covers. Where two credible studies disagree, I show both.
The short version
| Statistic | Figure | Source (year measured) |
|---|---|---|
| On Facebook and Instagram | Nearly all | M+R Benchmarks 2026 (2025) |
| On YouTube | 74% | M+R Benchmarks 2026 (2025) |
| Still using Twitter/X | 54% | M+R Benchmarks 2026 (2025) |
| Of those, planning to leave X | 31% | M+R Benchmarks 2026 (2025) |
| Average Facebook followers | 53,000 | M+R Benchmarks 2026 (2025) |
| Average Instagram followers | 18,000 | M+R Benchmarks 2026 (2025) |
| Producing video | 89% | Trends Report 2026 |
| Solo communicators producing video weekly | 16% | Trends Report 2026 |
| Working with influencers | 58% | M+R Benchmarks 2026 (2025) |
| Online revenue raised in December | 37% | M+R Benchmarks 2026 (2025) |
← Scroll the table sideways
How to read nonprofit statistics before you quote them
Two reliable studies can report very different numbers for the same thing, and both can be correct.
On TikTok usage, M+R Benchmarks 2026 found 43% of nonprofits were on the platform in 2025. The 2025 Nonprofit Tech for Good Survey found 15%.
Neither is wrong. M+R covers 180 mostly established US organisations with real online fundraising programmes. Nonprofit Tech for Good surveys nonprofits worldwide, including very small and volunteer-run ones.
Larger, better-resourced US nonprofits are far more likely to be on TikTok than small organisations globally.
Before using any nonprofit statistic in a board report, ask three questions: who was surveyed, how many, and what year? If the article does not say, do not use the number. Several widely shared roundups still carry 2023 figures under a 2026 heading.
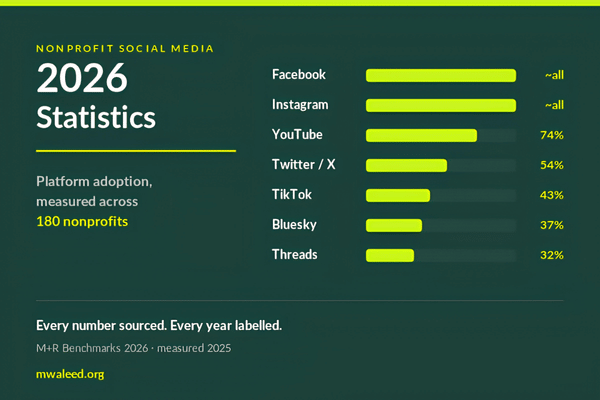
Which social media platforms do nonprofits use?
| Platform | Share of nonprofits present |
|---|---|
| Nearly all participants | |
| Nearly all participants | |
| YouTube | 74% |
| Twitter / X | 54% |
| TikTok | 43% |
| Bluesky | 37% |
| Threads | 32% |
Source: M+R Benchmarks 2026 · 180 nonprofits · measured 2025
These numbers describe what organisations already do, not what works. The interesting figure is Bluesky at 37%, higher than Threads and higher than most people expect. That is a direct consequence of nonprofits leaving X.
X is emptying out
- 54%still used Twitter/X in 2025, which M+R describe as a marked reduction
- 31%of those plan to leave or sunset the account
- −3%X was the only platform where nonprofit follower counts fell
Source: M+R Benchmarks 2026 · measured 2025
If you are a one-person team maintaining an X account out of obligation, the data supports letting it go. You would be joining a clear majority trend, not taking a risk. Put those hours into video.
Average follower counts by platform
| Platform | Average followers | Change |
|---|---|---|
| 53,000 | +3% | |
| 18,000 | — | |
| Threads | 13,000 | — |
| TikTok | 3,000 | Fastest growth |
| YouTube | 2,000 | — |
| Bluesky | 1,000 | — |
Source: M+R Benchmarks 2026 · measured 2025. M+R state TikTok growth as 34% in their summary and 37% in the body text of the same page.
Large follower counts on Facebook do not mean large reach. Facebook shows your post to a fraction of people who already follow you. TikTok shows it to people who do not.
Which number actually matters is covered in engagement vs reach for nonprofits.
Your cause type matters more than the platform
M+R compared two sectors with almost identical Facebook audiences, around 144,000 followers each.
| Platform | Animal welfare | Rights organisations |
|---|---|---|
| ~144,000 | ~144,000 | |
| 59,000 | 23,000 | |
| TikTok | 69,000 | 43,000 |
| Twitter / X | 9,000 | 39,000 |
Source: M+R Benchmarks 2026 · measured 2025
A benchmark for "nonprofits" as a single category is close to useless for planning. A food bank, a theatre and an advocacy group are not in the same business. Before comparing your account to a sector average, check whether it includes organisations like yours.
The Facebook and LinkedIn contradiction
From the 2026 Nonprofit Communications Trends Report, a survey of 322 communicators (80% US, 11% Canada):
- 31%say Facebook is most likely to reliably help them meet objectives, the highest of any platform
- 4%want to invest more time in Facebook
- 36%name LinkedIn as their top area for future investment
Meanwhile the Global NGO Technology Report found 68% of nonprofits post on LinkedIn less than once a week.
Attention is moving away from the platform that works, toward one most organisations barely use. That is not necessarily wrong. LinkedIn reports 2.2 million nonprofits and 22 million nonprofit professionals on the platform.
Do not quit Facebook because it feels tired. Make it cheap to maintain, then put the freed hours into LinkedIn, where almost nobody in the sector posts consistently. Choosing the right platforms walks through that decision.
Nonprofit video and Reels statistics
- 89%of nonprofits produce video content
- 49%produce testimonial or storytelling video
- 16%of solo communicators produce video weekly, vs 27% of large teams
- 47%of solo communicators produce video only a few times a year
Source: 2026 Nonprofit Communications Trends Report · 322 communicators
Almost everybody makes video. Almost nobody makes it consistently. The gap is not knowledge, it is time. One good 20 to 30 second video takes most people 40 to 70 minutes once you count sourcing, cutting, captioning and exporting.
The cheapest fix is to stop making polished video. Point a phone at one person for 30 seconds, ask one question, caption it, publish it. What that costs to outsource is covered in nonprofit social media management cost.
Nonprofit influencer statistics
- 58%worked with influencers at least once in 2025
- 100%of those programmes used Instagram. 72% also used TikTok
- 87%included accounts with 10,000 to 100,000 followers
- 61%included a direct fundraising ask; 74% included advocacy or volunteer asks
Source: M+R Benchmarks 2026 · measured 2025
The accounts being used are smaller than most people assume. You do not need a national influencer. A local account with 15,000 followers who genuinely cares about your cause sits inside the most common tier in the data, and is far more likely to say yes.
Only 24% of nonprofits paid every creator they worked with. M+R's own commentary argues for paying properly, on the grounds that unpaid partnerships produce weaker content.
Social media and fundraising: what social actually does
| Finding | 2025 figure |
|---|---|
| Online revenue, average change | +15% |
| One-time gift revenue | +17% |
| Monthly giving as a share of online revenue | 27% |
| Donor-advised fund revenue | +44% |
| Share of online revenue raised in December | 37% |
| New donor retention | 24% |
| Retention among established prior donors | 66% |
Source: M+R Benchmarks 2026 · 180 nonprofits · measured 2025
Notice what is absent: social media does not appear as a revenue line. For most nonprofits it is not where donations happen. It is where people first hear about you and decide whether you are credible. The transaction happens elsewhere.
Stop measuring social media against donation totals. Measure it against email signups, event registrations and volunteer enquiries. And if 37% of your online revenue arrives in December, plan that month in September.
AI and the search traffic decline
- 69%of M+R participants have policies or guidelines around generative AI
- ~50%used generative AI to produce written content; 1 in 4 for graphics
- 84%of nonprofit communicators use AI tools in some way
Sources: M+R Benchmarks 2026 (2025) and the 2026 Trends Report
M+R also report that the proportion of nonprofit websites' organic traffic dropped month by month throughout 2025, which they attribute to zero-click Google results and people asking chatbots instead of searching. Their conclusion is explicit: nonprofits now need an answer engine optimisation strategy alongside SEO.
The argument about whether to use AI is over. Most organisations already do.
The search finding matters more. If fewer people reach your website through Google, the channels you control directly carry more weight than they did two years ago. Treat your email list as the asset it is. It is the only audience no algorithm can take away from you.
What this means if you are a small nonprofit
Batch a month of posts, schedule them, move on.
Only 54% were still there in 2025, 31% of those plan to go, and it was the only platform where followers fell.
Making video faster matters more than making it better.
Animal welfare organisations have three times the TikTok audience of some sectors and a fraction of the X audience.
M+R found 62% of small nonprofits already work with a partner agency on digital work, against 75% of nonprofits overall.
For a starting structure rather than more numbers, see social media strategy for small nonprofits and how often nonprofits should post.
Sources
| Report | Publisher | Published | Measured | Sample |
|---|---|---|---|---|
| M+R Benchmarks 2026 | M+R | 2026 | 2025 | 180 nonprofits |
| 2026 Nonprofit Communications Trends Report | Nonprofit Marketing Guide | 2026 | 2025–26 | 322 communicators |
| 2025 Nonprofit Tech for Good Survey | Nonprofit Tech for Good | 2025 | 2025 | Global, self-selecting |
| Global NGO Technology Report | Nonprofit Tech for Good | Multi-year | Multi-year | Global NGOs |
| LinkedIn for Nonprofits | Current | Current | Platform data |
Several widely quoted nonprofit engagement-rate figures could not be verified at source, because the original report presents them only inside chart images rather than as text. Rather than repeat another site's reading of them, I excluded them. If you see a precise nonprofit engagement rate quoted without a checkable source, treat it carefully.